HOME Financial Information Income Statement
Income Statement
POSCO Holdings IR information is available at the official website. POSCO Holdings
Revenue
(Seperated, Unit: KRW billion)
POSCO financial results (standalone, Mar- 2022)
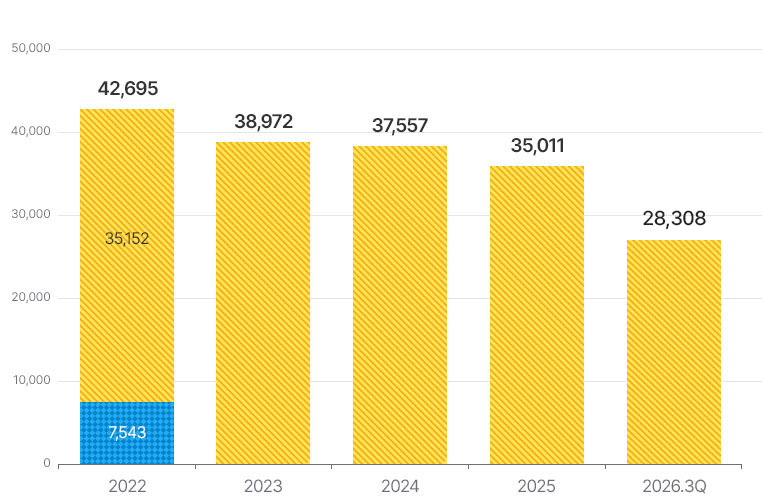
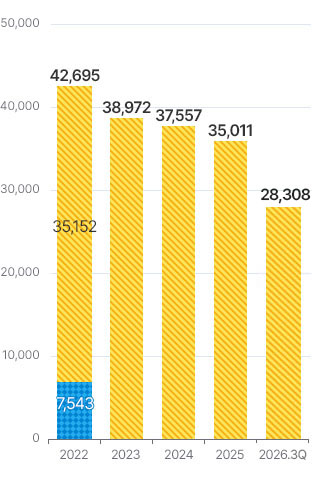
※ 2022 are POSCO’s standalone financials generated before the spin-off.
Operating profit
(operating margin) / (Seperated, Unit: KRW billion)
POSCO financial results (standalone, Mar- 2022)
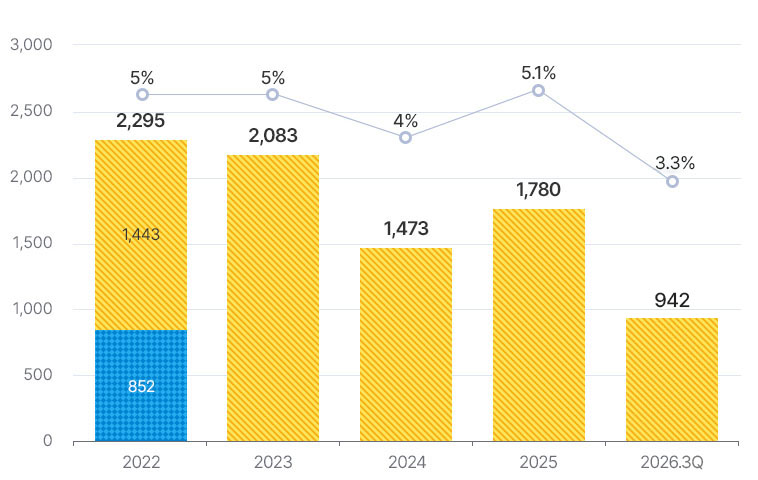
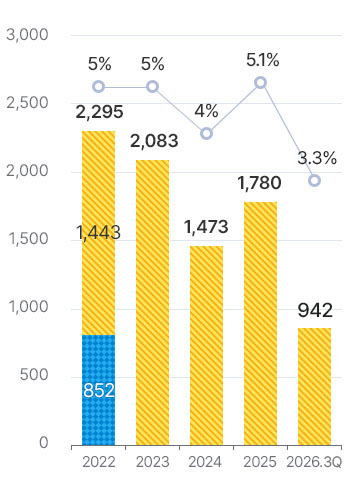
※ 2022 are POSCO’s standalone financials generated before the spin-off.
Net profit (net profit margin)
(Seperated, Unit: KRW billion)
POSCO financial results (standalone, Mar- 2022)
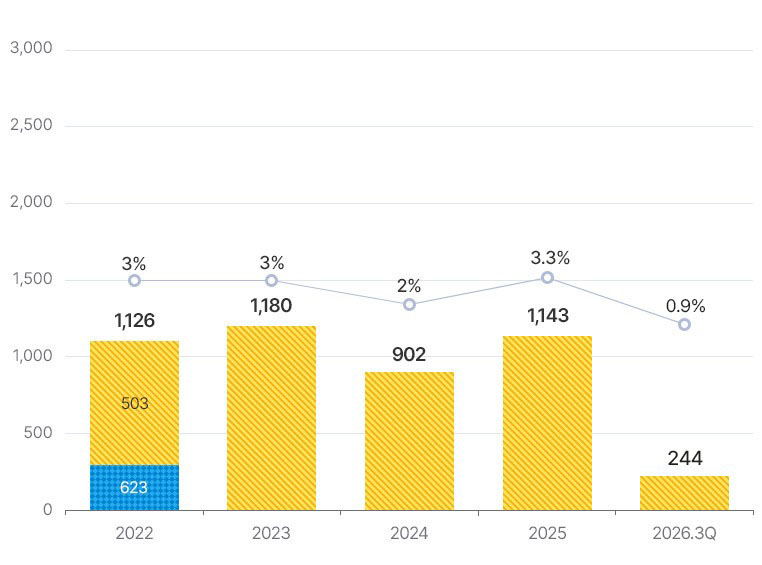
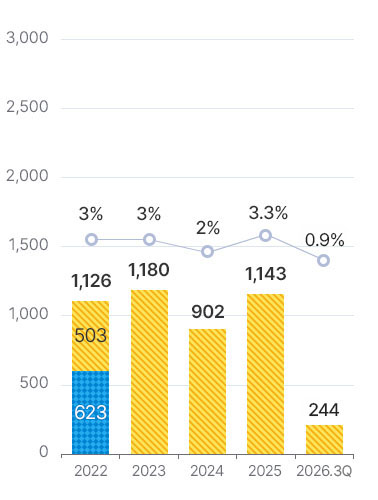
※ 2022 are POSCO’s standalone financials generated before the spin-off.
(Seperated, Unit: KRW billion)
| Classification | 2022 | 2023 | 2024 | 2025 | 2026.3Q | ||
|---|---|---|---|---|---|---|---|
| Jan-Feb | Mar-Dec | ||||||
| Revenue | 42,695 | 7,543 | 35,152 | 38,972 | 37,557 | 35,011 | 28,308 |
| Gross profit | 3,503 | 1,073 | 2,429 | 3,282 | 2,657 | 2,959 | 1,886 |
| Operating profit | 2,295 | 852 | 1,443 | 2,083 | 1,473 | 1,780 | 942 |
| Net profit | 1,126 | 623 | 503 | 1,180 | 902 | 1,143 | 244 |
| EBITDA | 4,674 | 1,253 | 3,422 | 4,410 | 3,932 | 4,230 | 2,704 |

※ 2022 are POSCO’s standalone financials generated before the spin-off.